
Summary Statistics: Measures of Spread Page 1/3
The table below shows the first 10 cases of a data set.
|
Variables |
|||
|
ID |
V1 |
V2 |
V3 |
|
1 |
Red |
25 |
1.62 |
|
2 |
Blue |
35 |
1.58 |
|
3 |
Yellow |
44 |
1.35 |
|
4 |
Green |
28 |
1.54 |
|
5 |
Black |
35 |
1.35 |
|
6 |
Brown |
42 |
1.21 |
|
7 |
Blue |
36 |
1.76 |
|
8 |
Pink |
38 |
1.57 |
|
9 |
Green |
30 |
1.47 |
|
10 |
Purple |
40 |
1.18 |
|
: |
: |
: |
: |
Welcome to the "Measures of Spread" quiz. There are 10 questions to answer.
Please remember to click the Submit button for each separate question, and read the feedback comments!
Click the Next button to begin the quiz.
Q1. Which of the following are measures of dispersion?
The correct answers are b), d), e) and i). A measure of dispersion quantifies the spread of the variable. A measure of dispersion is often presented alongside an appropriate measure of central tendency.
Q2. The heights (cm) of 6 children were measured as 141, 155, 130, 146, 141, 134.
What is the range of the data?
The correct answer is d). The range is the difference between the minimum and the maximum. The minimum is 130 and the maximum is 155. Therefore the range is: 155-130 = 25.
Q3. The heights (cm) of 6 children were measured as 141, 155, 130, 146, 141, 134.
What is the standard deviation of the data? Use 141.1667 as the value for the mean to keep the precision. Use Excel or a calculator.
The correct answer is a). The standard deviation shows how much variation or dispersion there is from the mean. It is expressed in the same units at the data. The standard deviation in this case is 8.84 (2 d.p.). Click here to see the formula for a sample standard deviation(s).
Q4. As in the previous questions, the heights (cm) of 6 children were measured as 141, 155, 130, 146, 141, 134
What is the variance of the data? Use 141.1667 as the value for the mean to keep the precision. Use Excel or a calculator.
The correct answer is c). The variance is the square of the standard deviation. Therefore the variance is 17.68 (2 d.p.).
Q5. The bar chart illustrates the distribution of variable “V1” from this study. Using the data in the table and graph, choose the most suitable measures of dispersion to report the spread of variable “V1”.
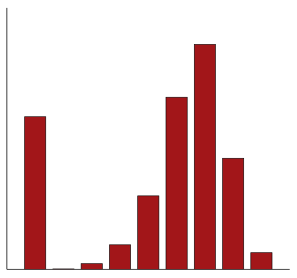
The correct answer is h). The bar chart is used to display the frequency of a categorical variable. This categorical variable is purely nominal. It does not make sense to report a measure of dispersion for a variable of this type.
Q6. The histogram illustrates the distribution of variable “V2” from this study. Using the data in the table and graph, choose the most suitable measure(s) of dispersion to report the spread of variable “V2”
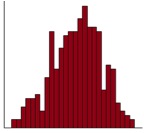
The correct answers are a), c), d) and e). The histogram is used to display the distribution of a continuous variable. It is showing a bell-shape distribution, suggesting it has a Normal distribution. Standard deviation, range (or minimum and maximum) are the most suitable measure of dispersion for this type of variable with such a distribution.
Q7. The histogram illustrates the distribution of variable “V3” from this study. Using the data in the table and graph, choose the TWO most suitable and informative measure(s) of dispersion to report the spread of variable “V3”.
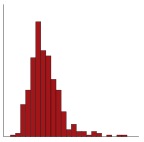
The correct answers are f) and g). The histogram is used to display the distribution of a continuous variable. It is showing a skewed distribution, suggesting there are some outliers in the data. The lower quartile and upper quartile are the most suitable and informative measures of dispersion for a variable with this type of distribution. These are not affected by outliers and extreme values. Note that the minimum and the maximum could be reported here to highlight the skewness / extreme values but they are not the most suitable measures. Likewise, the IQR is less informative than the lower and upper quartiles and so these are preferable.
Q8. Which of the following statements are true?
The correct answers are a) and b). c) The standard deviation is sensitive to outliers and extreme values in the same way as the mean. d) The upper quartile is the 75th percentile of the ordered data. The 25th percentile is the lower quartile.
Q9. Which of the following statements are true?
The correct answers are b) and c). a) The inter-quartile range is the difference between the 25th percentile and the 75th percentile of the data. c) The box in a box and whisker plot represents the central 50% of the data and is bounded by the lower and the upper quartile.
Q10. Which of the following statements are true?
The correct answers are b) and c). a) The standard deviation is sensitive to outliers and extreme values in the same way as the mean.
You have completed the quiz and here is your result:
If you would like to try this quiz again, click here.
You have not answered questions 1, 2, 3, 4, 5, 6, 7, 8, 9, 10.
Please go back and complete the questions.
Please remember to click submit for each question, and read the feedback comments!
Score 0/0