<%@LANGUAGE="VBSCRIPT" CODEPAGE="65001"%> Flow chart for Which Statistical Test

Which Statistical Test?

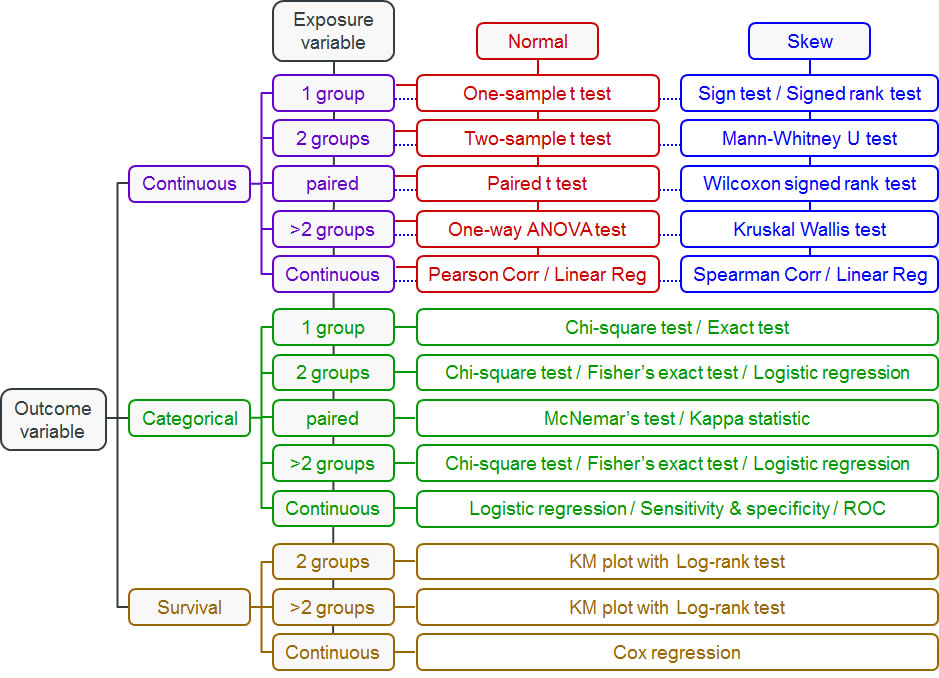
Use the table to obtain informaton on how to carry out the test in SPSS and how to report and present the results.

Move the cursor over the boxes that classify the tests for further details. Click on the statistical tests for more details.

Outcome variable Continous Categorical Survival Exposure Normal Skew Continuous 1 group Categorical 1 group Continuous 2 groups Continuous paired Continuous more than 2 groups Continuous - Continuous Categorical 2 groups Categorical paired Categorical more than 2 groups Categorical - Continuous Survival 2 groups Survival more thasn 2 groups Survival - Continuous One-Sample t test Sign / Signed rank test Two-sample t-test Paired t test Mann-Whitney U test One-way ANOVA test Kruskal Wallis test Rearson Correlation Linear Regression Linear Regression Spearman Correlation Chi-square Exact Test Chi-square / Fisher’s exact test Logistic regression McNemar’s test Kappa statistic Chi-square / Fisher’s exact test Logistic regression Logistic regression Sensitivity & specificity ROC Log-rank test Log-rank test Cox regression

Please Report any issues to Brian Yuen